Building a patient identification system for pediatric malnutrition treatment in Nigeria
Problem: many of our patients lack documentation that could serve as a form of identification.
Our solution: we built Taimaka ID, a facial recognition system capable of identifying patients with a 99% true acceptance rate, 99% true rejection rate, and 97% top-three accuracy. Accurate identification of returning and relapsed patients is possible up to roughly five months between visits. This system is both hygienic and relatively cheap to implement, offering contactless identification to reduce the risk of pathogen transmission and is deployed on smartphones already in use by clinic staff at our treatment sites. It will help us maintain high quality records of individual care and avoid duplication of care as we expand our program to include 15-20 additional sites over the next twelve months.
Data privacy and ethical considerations: we developed this system specifically for our Nigerian pediatric patients in order to prevent algorithmic bias inherent in publicly available facial recognition tools. Furthermore, the system is not autonomous; trained personnel verify each match to prevent identity theft and use manual visual comparison to prevent false rejections from blocking access to care. Patient photos are captured and processed only on password-protected, organization-managed devices. Processing occurs in a mobile application that we created, and access to this application is managed on a user-specific basis. Patient data is securely transmitted to a remote, user-access-controlled database.
Introduction
Reliable identification of patients in community-based management of acute malnutrition (CMAM) programs is essential for delivering life-saving health and nutrition services to every child. Consistent identification throughout the course of treatment enables effective monitoring of nutritional supplements, seamless referrals between outpatient and inpatient services, and the prevention of duplicate services for the same child. It also makes it easier to identify children who relapse and return to treatment after initial recovery. In Nigeria, Taimaka provides pediatric malnutrition treatment to children under five, where 70% of children are unregistered and 83% lack birth certificates—leaving them without documentation that could serve as a form of identification. From 2023 to 2025, 50% of children presenting at our program sites had no formal document containing their name and date of birth, while 48% had a vaccination card and <2% had a birth certificate.
To mitigate this issue, we have built a biometric authentication system which relies in part on facial recognition. Facial recognition systems use neural networks to compare an image of a face to other images of faces. Images are first passed to a model for detecting facial landmarks like the eyes, mouth and nose. Given the predicted landmark locations, the image is cropped and rotated to center the detected face, and the cropped image is then passed to a second model which creates the “embedding” or “template,” a vector of numbers representing the characteristics of the face. Embeddings can be compared against each other to determine if the face belongs to the same or a different patient.
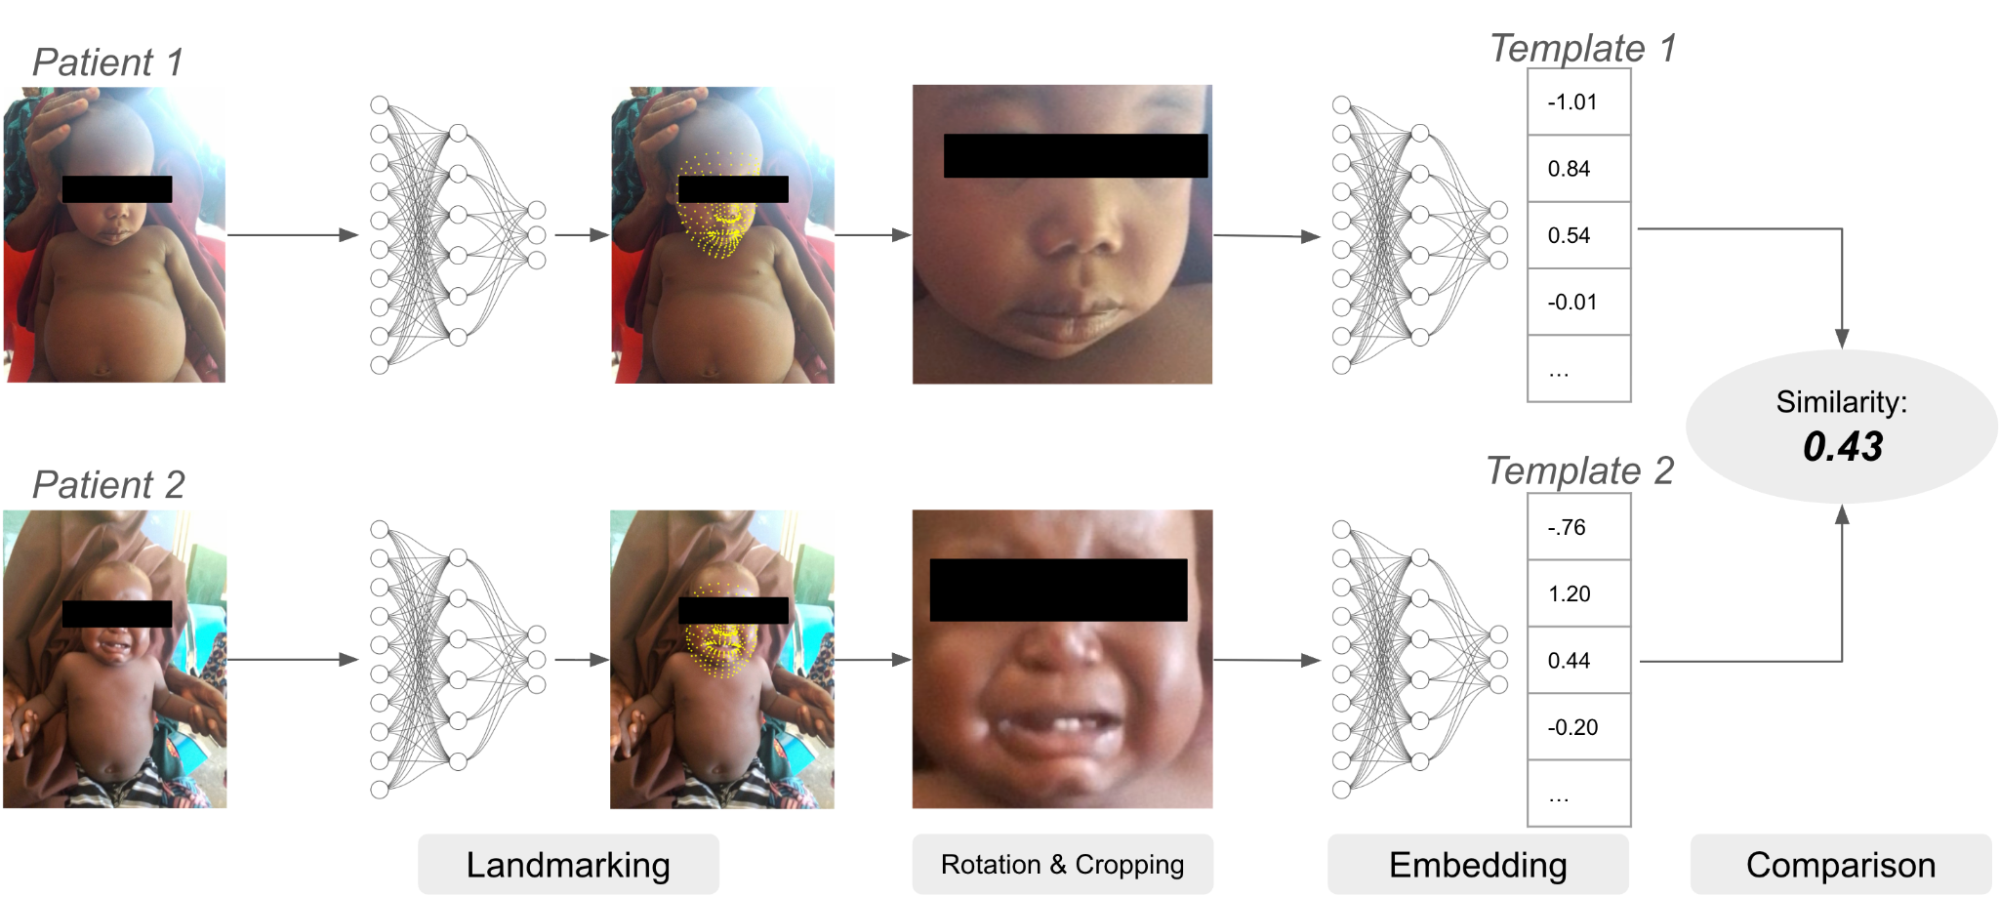
An example of a facial recognition system. The landmarking model identifies locations of important facial features like eyes, nose, mouth, etc. Using these landmarks, the image is transformed and cropped and then passed to the embedding model, which creates the embedding vector for each image. Finally, the two embeddings are compared.
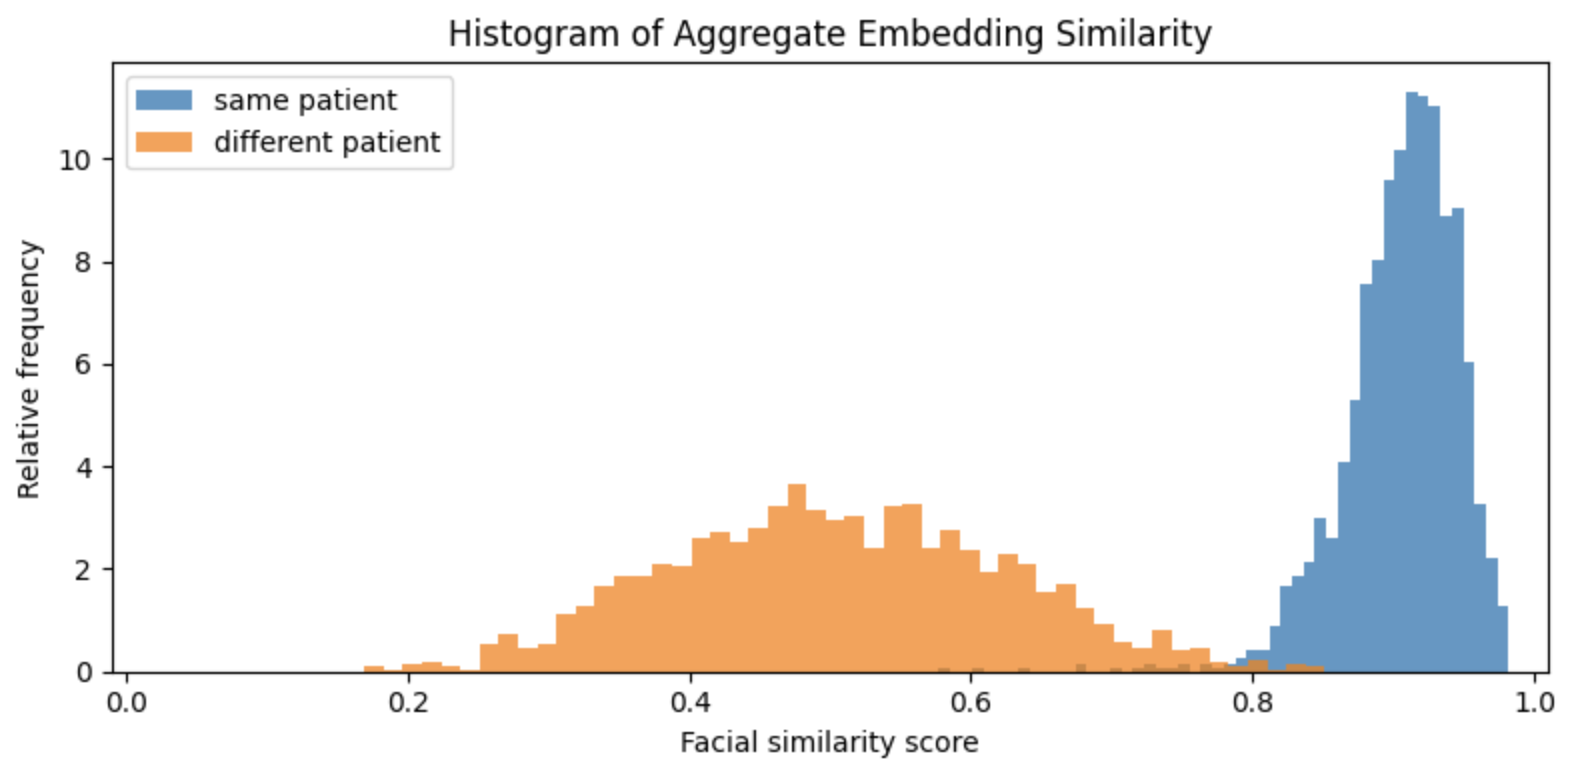
Open-source models exist for both face detection and embedding. In our experiments, Google’s MLKit for face landmark detection worked well, so we adopted it as our landmarking model. We tested a number of embedding models for template creation and comparison, and while FaceNet provided better results than DeepFace or EdgeFace, we found that FaceNet embeddings of different patients were still too similar to provide reliable authentication of malnourished Nigerian children under five years old. This is visible in the figure below, which shows the distributions of facial similarity scores of pairs of photos for the same and different patients:

Similarity scores based on embeddings created by FaceNet. The orange histogram represents the distribution of similarity scores computed on two photos of different patients, and the blue histogram represents the distribution of similarity scores of two different photos of the same patient. There is significant overlap of these two distributions which implies that false rejection and acceptance rates would be too high to be useful.
On average, FaceNet quantifies the similarity of two different patients almost as highly as the similarity of two photos of the same patient. In other words, it is unable to tell many of Taimaka's patients apart from one another. This algorithmic bias is not altogether unsurprising. FaceNet was trained on 100-200 million images of roughly eight million people, and it is exceedingly unlikely that Nigerian children under five years old represent any meaningful proportion of that dataset. However, there is some separation between the two similarity distributions above, which indicates it may be possible to improve FaceNet embeddings by adapting FaceNet specifically to Taimaka’s patients.
Method
This section contains technical information that may be unfamiliar to readers without machine learning experience. You may find it beneficial to first review neural networks, e.g., here and here, or alternatively, skip to the Results section.
Model architecture
To help the reader gain understanding into how FaceNet works, imagine FaceNet takes an input image and processes it into three numbers: (x, y, z). These three numbers are the “embedding” of the input image and represent locations in an abstract 3-dimensional space. The purpose of FaceNet is to cluster images of the same patient closely together in this embedding space, while simultaneously pushing images of different patients further apart. For example, a good outcome would be if the embeddings of two photos of the same patient are (0, 0, 0) and (0.01, 0, 0), and the embeddings of two photos of another patient are (-1, -1, -1) and (-1, -1.01, -1). In reality, FaceNet embeddings are in 512-dimensional space, rather than just three.
Taimaka’s adaptation of FaceNet uses the original FaceNet architecture (described in Table 2 here and visualized in Figure 3 here) as a base model, and attaches a custom “head” or auxiliary model that takes FaceNet embeddings as input, and subsequently outputs a new embedding.

An illustration of the architecture of our FaceNet model. The image of a patient’s face first passes through the base FaceNet architecture which outputs a 512-dimensional embedding. That embedding then passes through a custom head consisting of two layers. The final output is a 128-dimensional embedding. (This diagram is for illustration only; the actual number of FaceNet layers is much larger.)
The head consists of two fully-connected layers, the first of which is followed by batch normalization, in which the layer output is normalized to have zero mean and unit standard deviation to avoid the need for careful parameter initialization, followed by a rectified linear unit (RELU) activation function to introduce nonlinearity. The second layer is followed by L2-normalization, so that the final output of each image is a unit-length vector which removes variability of the embedding due to unimportant differences like image brightness or resolution. Some experimentation determined that 1000 and 128 are good values for the dimensions of the first and second layers, respectively, though no formal hyperparameter tuning was conducted. Specifically, 512 units (the output dimension of FaceNet) was also tested and did not perform better than 128, so 128 was used to reduce storage cost of patient templates and computational cost of template comparison. Finally, red-green-blue (RGB) images have pixel values in the range [0, 255], but FaceNet expects the input image to have pixel values in the range of [-1, 1]. Therefore we add a scaling layer at the input so that the saved model object automatically provides the necessary scaling to RGB images from the camera when deployed on mobile devices.
Cosine triplet loss
The model was trained to minimize the cosine-margin-triplet loss to encourage embeddings of the same patient to cluster together and to push embeddings of different patients apart. The embeddings output by the model are 128-dimensional vectors with length equal to one, which can be visualized as points on a 128-dimensional sphere with radius equal to one. We can define the “distance” between two embeddings as the angle between them, and we can define their “similarity” as the cosine of that angle. As an example, the distance between two identical vectors is zero, and the similarity is therefore one; the distance between two exactly opposite vectors is 180 degrees, and the similarity is therefore -1. The cosine of the angle between two unit-length vectors can be computed with their dot product, which is an efficient calculation to make on devices with limited processing power.
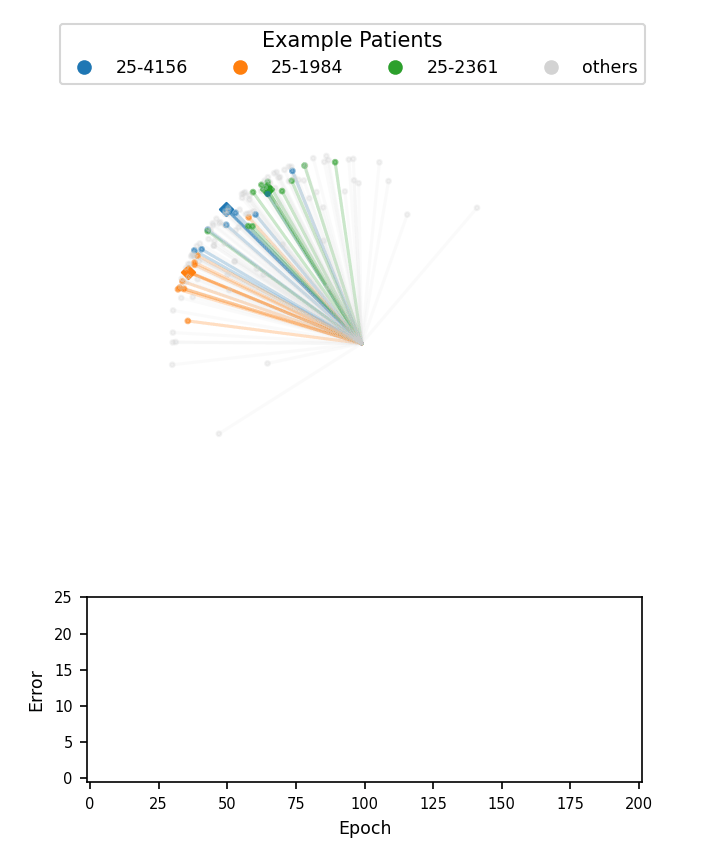
A visualization of face embeddings in three dimensions. Vectors that end in a dot are embeddings of a single photo, and vectors that end in a diamond are the average embedding of all photos for a given patient. As model training progresses, embeddings of different patients are pushed further apart. Note that the actual embeddings used in our system lie on a 128-dimensional hypersphere, rather than the 3-dimensional sphere used for this visualization.
During training, each observation in a batch consisted of a triplet: an “anchor” photo; a “comparison” photo, which is a different photo of the same face as the anchor; and a “negative” photo, which is a photo of a different face. The cosine-margin-triplet loss is computed on each triplet in the batch as follows:

The formula for the cosine-margin-triplet loss. θ+ is the angle between the anchor and comparison embedding, and θ- is the angle between the anchor and negative embedding. The hyperparameters s and m are the radius and margin, respectively.
In the above equation, θ+ is the angle between the anchor and comparison embedding, and θ- is the angle between the anchor and negative embedding. We rewrite the formula to make it a bit clearer how it works:

The original formula is rewritten here in order to help the reader understand how it works.
When this loss is minimized, the first summand pulls the anchor and comparison embeddings closer together, and the second summand pushes the anchor and negative embeddings apart. When s=1 and m=0, the first summand is simply the negation of the cosine similarity between the anchor and the comparison embeddings.
The loss introduces two more hyperparameters: the radius s, which distributes learned embeddings on a hypersphere of radius s to encourage embedding separability and improve convergence of the training loop, and margin m, which increases compactness of same-patient embeddings and discrimination of different-patient embeddings. Experiments showed 128 and 0.2 to be good values for s and m respectively, though no formal hyperparameter tuning was conducted.
Training data and strategy
53,381 photos of 7,347 patients were available for training and evaluation of the model. Photos were pre-processed using Google’s MLKit. Images were kept if they met the following requirements:
Exactly one face is detected in the photo
Confidence of face detection must exceed 50%
Both eyes, both corners of the mouth, and nose must be present in the image.
52,382 images of 7,068 patients (roughly seven images per patient) remained after this preprocessing step. The faces in the images were then aligned, cropped and resized to 160x160 pixels, the required input size of FaceNet. Unique patients were then randomly divided 80%-10%-10% into training, validation, and test sets respectively, such that all photos of a given patient were entirely within a single set and there was no overlap of patients across sets. The training set was used for gradient descent, the validation set used for hyperparameter selection and early stopping of the training loop when convergence was achieved, and the test set was used for final evaluation of performance.
Triplet construction was performed randomly for each batch. Given a set of randomly selected anchor embeddings, the comparison embeddings for each anchor were randomly selected from photos of the same patient, and negative embeddings were randomly selected from the remaining patients. Anchor embeddings were selected from among patients that have more than one photo, but the negative embedding could come from a patient with any number of photos. These triplets were then used to compute the cosine-margin-triplet loss.
The base FaceNet architecture was initialized with its pre-trained weights, and the custom head was randomly initialized. Training occurred in three phases:
Transfer learning: all FaceNet weights were frozen, and the custom head was trained with an initial learning rate of 1e-3. This phase trained the custom head to process FaceNet embeddings into new embeddings that better discriminate between Taimaka’s patients.
Fine tuning: the top third of FaceNet was unfrozen, and it and the custom head were trained together with an initial learning rate of 1e-4. In this phase, the first several layers of FaceNet were still used for extracting general information from a face, but the higher-order representations were tuned to be more relevant for Taimaka’s patients.
Training: the full model was unfrozen and trained with an initial learning rate of 1e-5. This phase attempted to teach the model to better extract general information from the faces of Taimaka’s pediatric patients.
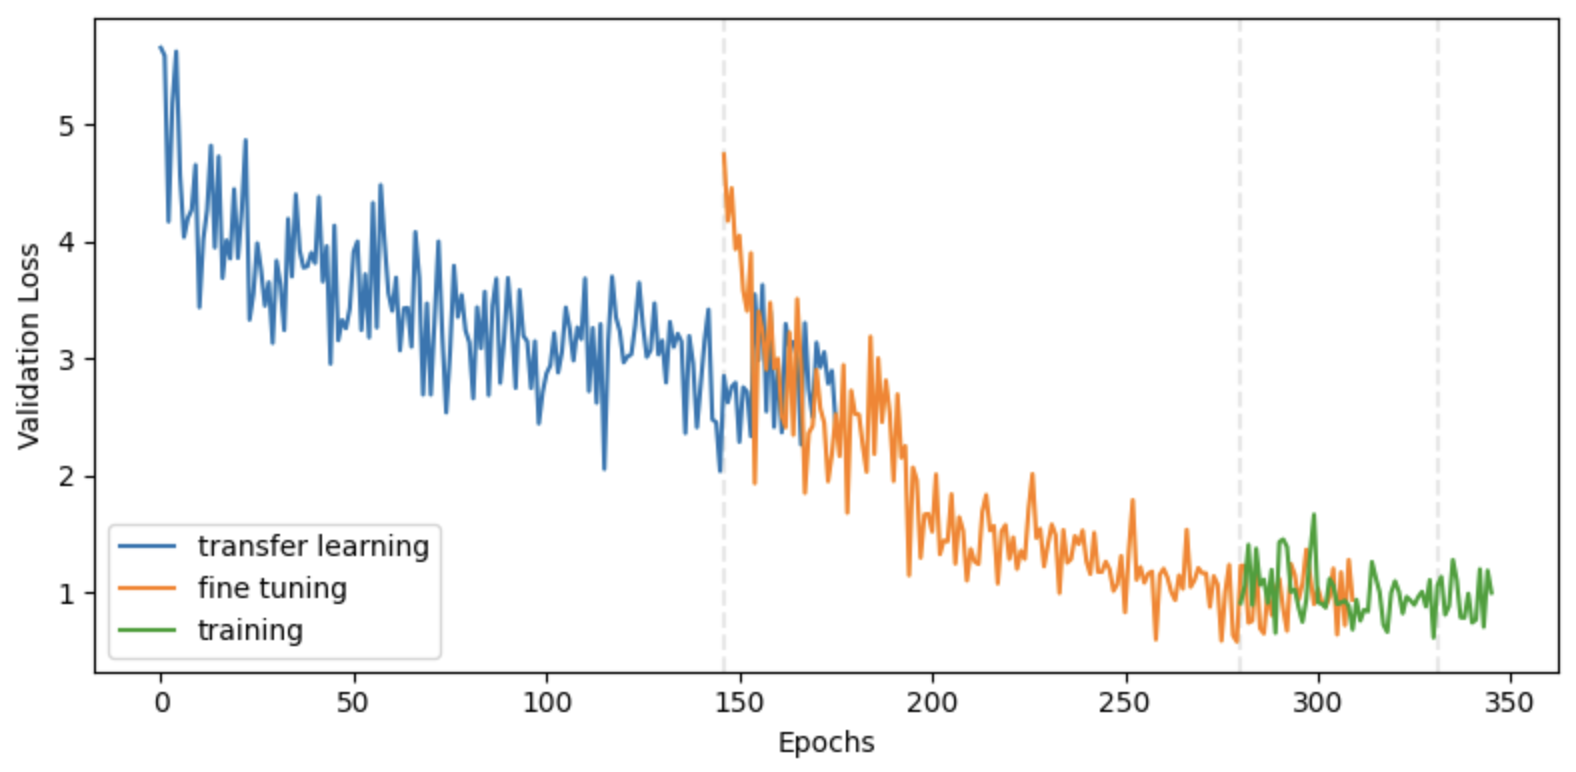
Cosine-margin-triplet loss on the validation dataset over each phase of training. The epoch with the best loss is marked with a vertical dashed line for each phase.
For all three phases, the model was trained up to a maximum of 1000 epochs. If the loss on the validation set was not reduced after 15 epochs, the learning rate was halved. If the validation loss was not reduced for another 15 epochs, then the phase ended and the next phase began. Model weights were cached throughout the training process and the model with the best validation loss was restored at the end of each phase. The full training phase did not result in a meaningful improvement over the fine-tuning phase, indicating that the lower layers of FaceNet are adequate for extracting general facial characteristics from Nigerian pediatric patients. Though this model architecture was conducive to accelerated training on GPUs, it was trained for roughly 48 hours on my M2 Macbook Air to save on cost and emissions.
Results
Adapting FaceNet to Taimaka’s patient photos resulted in significantly more separation between the distributions of facial similarity scores. Our FaceNet model more effectively differentiates between our patients than the original.
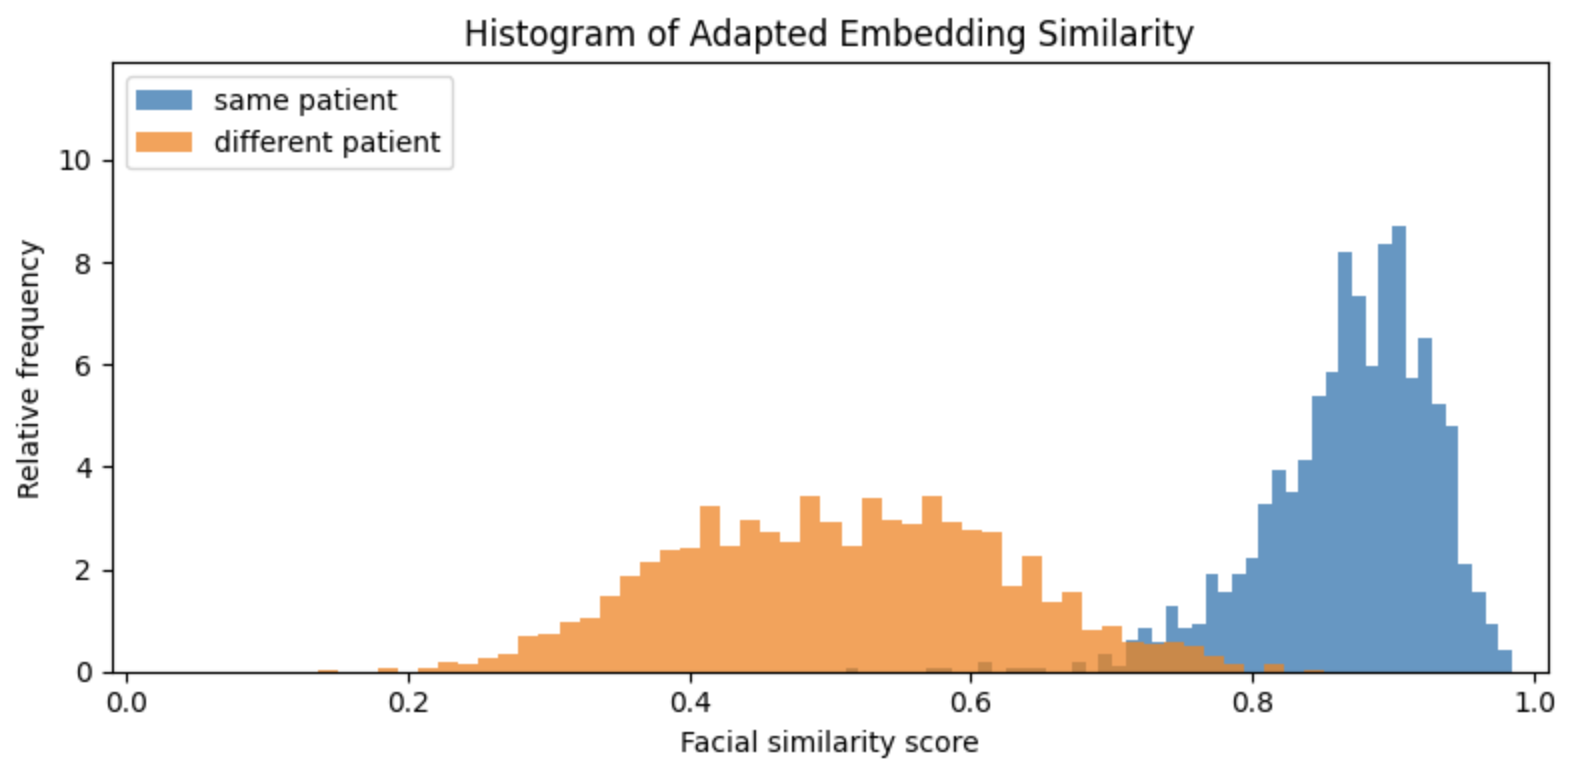
Similarity scores based on embeddings created by our new version of FaceNet that has been trained on Taimaka patient photos. There is now considerably more separation between the two distributions.
By setting a similarity threshold of about 0.75, the model can accurately differentiate between true and false matches with minimal error. In this setup, we're comparing the two most recent photos of each patient, simulating a system in which the face template is replaced with a new photo on every visit. But what happens if the new photo isn't ideal? Since this facial recognition system is designed for use in outpatient treatment settings, photos are taken in uncontrolled environments where children may not always cooperate. If the patient is crying, turned away, or the lighting is poor, the most recent photo might not be the best representation for future comparisons. To explore this further, we conducted a simple experiment where, instead of using just the most recent photo, we compared the patient photo embedding to the average of all previous photo embeddings for that patient to see if that improved model performance.
Similarity scores based on averaged embeddings. The separation has further improved.
The distributions are now separated even better. By combining templates with a simple average, we have managed to push the similarity distribution a bit further to the right, and a cutoff of 0.8 results in even better matching. This is likely because the average template “smooths over” anomalous templates that may have been created on blurry or poorly lit photos or on photos of patients in uncommon poses.
Taimaka’s patients are young, malnourished children, and a child’s face can dramatically change over the course of a few months as they recover and develop. While averaging templates appears to create some improvement, there may be better ways to combine templates than a simple average; for example, we may want to weight recent photos more than earlier photos. We test this with exponentially weighted moving average (EWMA) templates. EWMA updates templates with a weighted average of the previous template and a new template. For example, if we initialize a template for a given patient with the template from their first photo, then subsequent updates to the template are given by
template ← w * new photo + (1-w) * template,
where the recency weight w is a value between 0 and 1. Higher values of w will prioritize the most recent photo. When w=0, the first photo is used as the template throughout the patient’s participation in the program. When w=1, the template is always replaced with the most recent photo.
We tested a range of recency weights to identify the best template updating mechanism. To formalize this, we tracked three metrics:
True acceptance rate (TAR): how often a returning patient’s photo is accurately matched to their previous template
True rejection rate (TRR): how often non-patients are accurately identified as not being a patient
Top-three accuracy: how often a patient’s template is found in the top three matches when compared against all templates in the database.
TAR and TRR are representative of performance of one-to-one comparisons, when we simply verify that a returning patient is who they say they are. Top-three accuracy reflects performance for new enrollments: when a new patient visits a treatment site, a user of this system will scan the patient’s face with a mobile device, it will be compared to a database of existing and past patients’ templates, and the top matches will be presented to the user, who can visually and manually confirm whether or not a correct match was identified in the top three matches.
The analysis shows a clear pattern. Performance is poorest when using the first photo as the template throughout the program. Performance increases as the recency weight increases up to about 0.4, and then begins to degrade. The best performing EWMA template is not better than a simple average template.
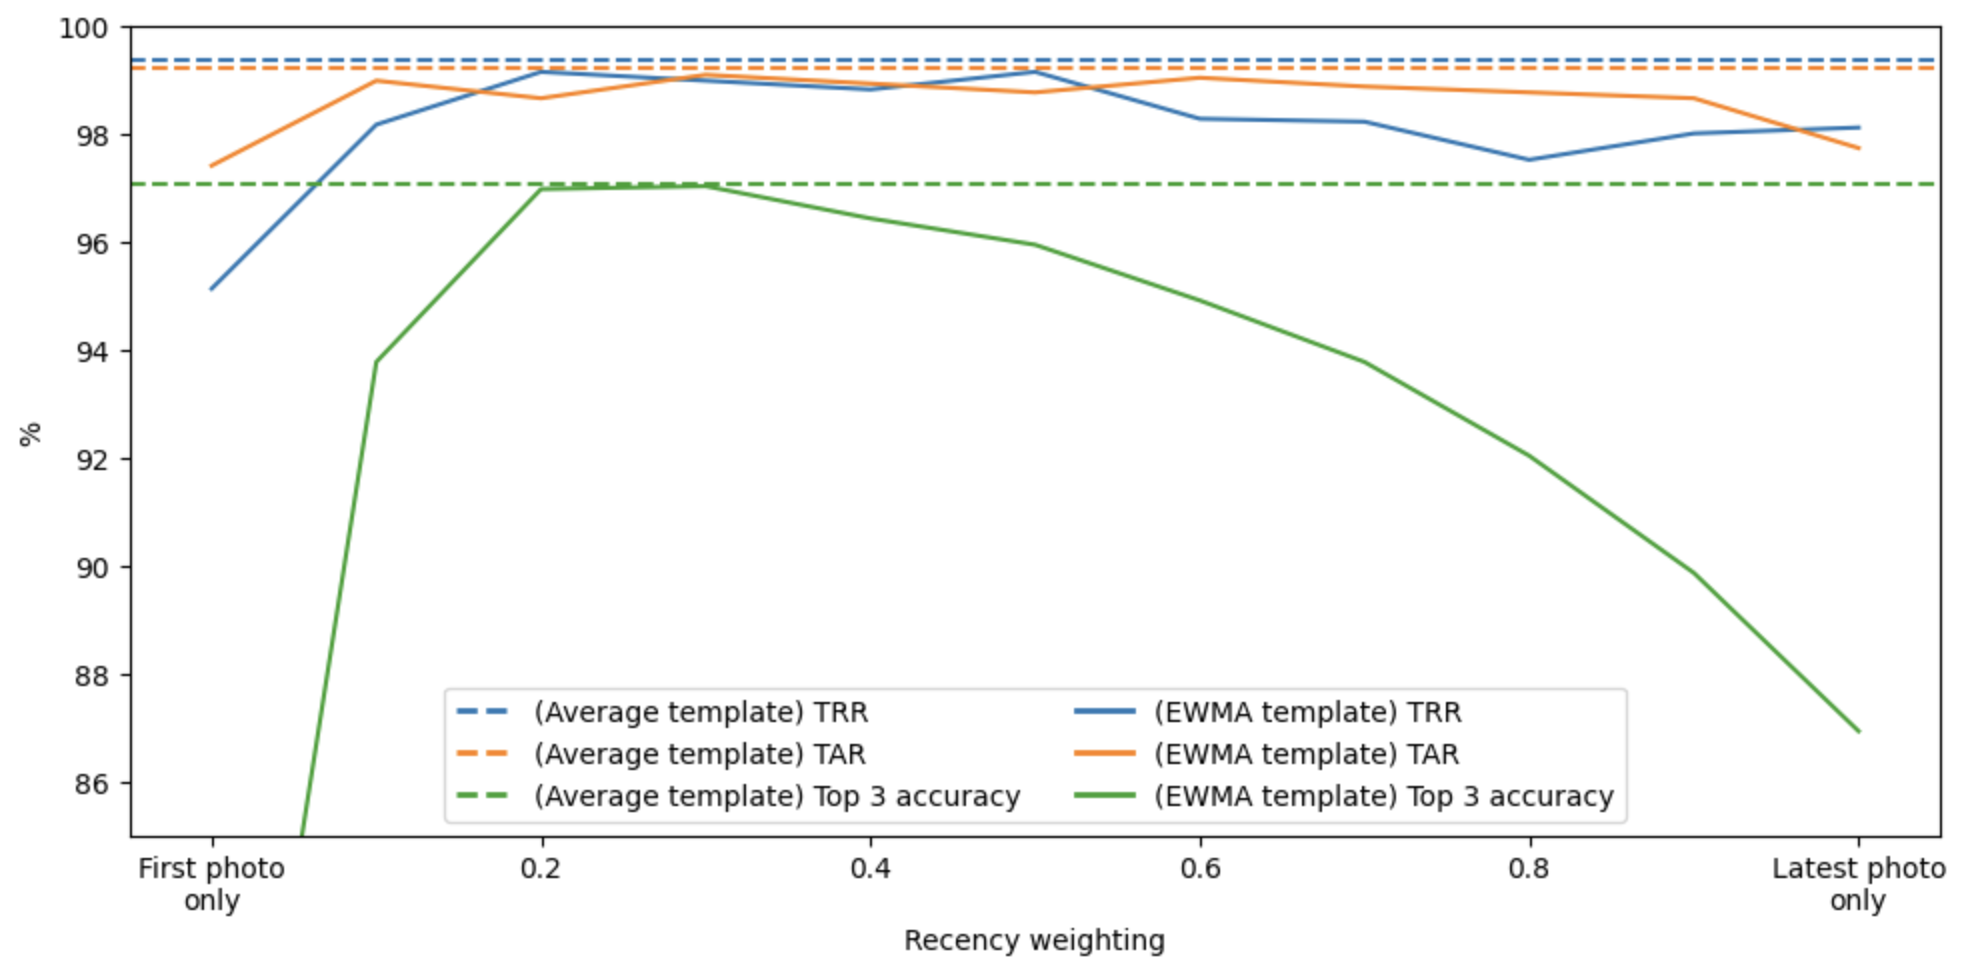
Performance as a function of the recency weight w. The solid lines are the metrics for EWMA templates, and the dashed lines are the metrics for a simple average template, provided for comparison. The blue, orange, and green lines are true rejection rate (TRR), true acceptance rate (TAR), and top 3 accuracy, respectively. While a recency weight of around 0.4 is optimal, it is not better than a simple average template.
For our final facial recognition algorithm, we use simple average embeddings and a comparison cutoff of 0.8, which results in a 99% TAR, 99% TRR, and 97% top-3 accuracy. When spot-checking errors, photo quality was a common cause of false rejections, and twins were a common cause of false positives (though these were not the only errors, and not all errors were investigated).
Long-term checkback experiment
These results are promising. However, the vast majority of photo comparisons are occurring on photos that were taken 1-12 weeks apart. Given this constraint, the above analysis suggests that facial recognition will be effective at preventing duplicate services to the same child, but we cannot yet say that facial recognition facilitates longer-term monitoring and relapse identification. Relapses can occur at any time after initial treatment, and during that time, the child’s face can change significantly as they develop and grow.
To quantify how performance degrades over time, we conducted an experiment in which we followed up with patients who were previously enrolled in the program. Survey teams traveled to villages to find and photograph these patients, given their caregivers’ consent. We collected new photos from 102 past patients and calculated the facial similarity scores of these new photos against their past templates. Results show that after about a five month lag, patients are no longer consistently matched to their past templates.

Facial similarity scores for 709 photos of 102 patients. The cluster of points on the left are the photos from the original visits, and the cluster on the right are the photos from the checkback survey. A trend line and 95% prediction band are shown, and the horizontal dashed line is the cutoff used for matching.
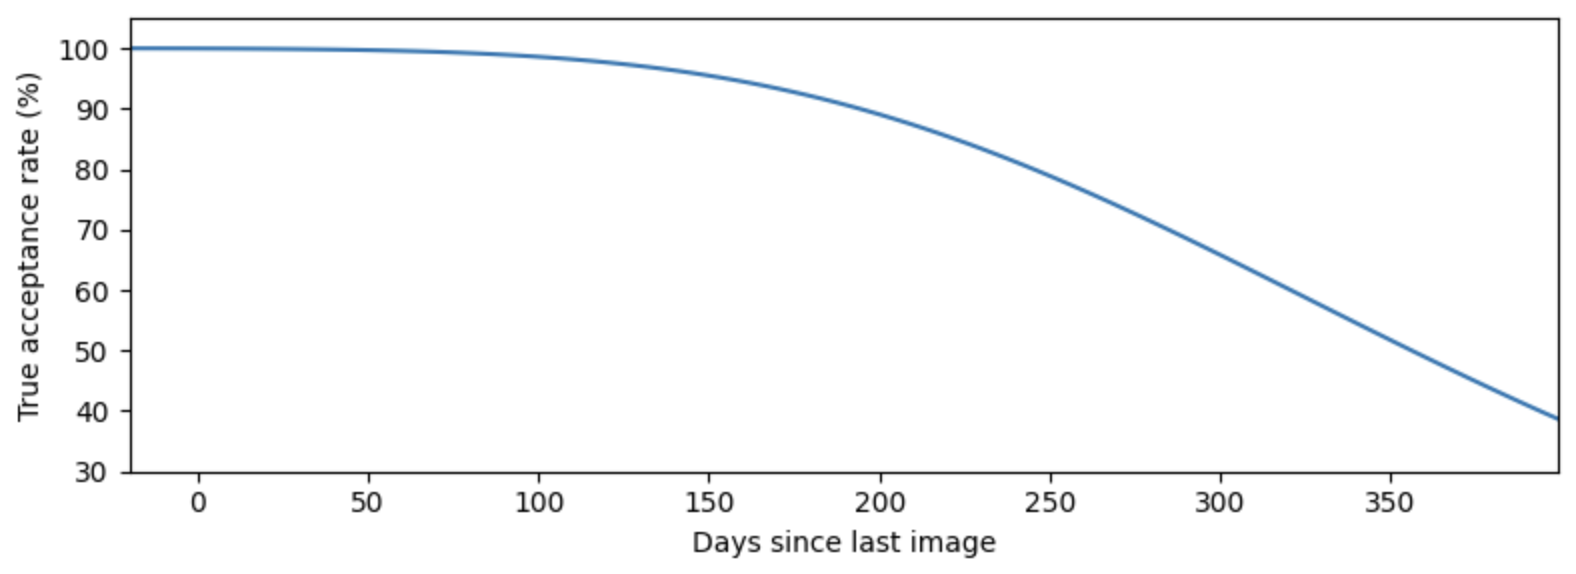
True acceptance rate of returning patients as a function of time. The true acceptance rate is calculated from the fitted trend in the previous figure using the proportion of the estimated distribution that lies above the matching cutoff of 0.8. Performance degrades significantly when the lag between visits exceeds five months.
Conclusion
Taimaka has developed a facial recognition model for authenticating CMAM patients. For new patients, faces are scanned and compared to the entire database of facial scans to check if they were previously enrolled or are currently enrolled at another site. When a patient exists in the database, the correct match appears within the top three results 97% of the time. Clinic staff are then shown photos and metadata of the top matches and manually confirm the result. On return visits, active patients scan their faces, which are then used for one-to-one matching, resulting in accurate confirmation 99% of the time. Furthermore, unenrolled individuals were mistakenly identified as enrolled patients just 1% of the time.
Importantly, the system is not autonomous; trained personnel verify each match to prevent identity theft and use manual visual comparison to prevent false rejections from blocking access to care. A searchable database of past patient photos and data is securely stored on the device to provide a backup verification system in case the matching process fails. This "human-in-the-loop" approach to using biometric technology is essential for simultaneously ensuring accurate patient verification and access to treatment.
As children recover, their facial scans are updated at each visit. Regular updates are especially important for matching the facial scans of children with severe wasting, whose appearance can change dramatically as treatment progresses and they gain weight. We found that the performance of the facial recognition model declines as patients recover and grow, limiting its effectiveness for monitoring and identifying relapsed patients more than roughly five months later. Fingerprints or palm prints may offer more stable performance, as these features are less affected by physical changes in malnourished children.
We observed several unexpected benefits. In addition to real-time, on-device verification at treatment sites, our system also supports remote, asynchronous investigation. Facial templates are stored in a secure remote database, and we developed tools that allow our analysts to search for patients by photo or to identify pairs of patients with similar face templates and names. These tools have been instrumental in additional studies, helping to link previously unconnected visits to the same patient and to improve program quality by refining relapse estimates and protocols for returning patients.
Hunter Merrill conducted this work in Gombe, Nigeria as a Program Improvement Fellow for Taimaka during September and October 2025. He is grateful for the significant support provided by Justin Graham and Muhammad-Kabir Alibaba.